Linux come with many built in commands to monitoring the system. You can check your system performance with these tools from cpu load, memory usage, network traffic, and etc. From this monitoring tools you can check what is the cause the server not on its normal performance.
Below are the tools to check your Linux system health:
1. top
top (table of process) command will show you a dynamic real-time view of a running system i.e. actual process activity. It update every 5 seconds.
top hot keys:
t Displays summary information off and on.
m Displays memory information off and on.
A Sorts the display by top consumers of various system resources. Useful for quick identification of performance-hungry tasks on a system.
f Enters an interactive configuration screen for top. Helpful for setting up top for a specific task.
o Enables you to interactively select the ordering within top.
r Issues renice command.
k Issues kill command.
z Turn on or off color/mono
2. netstat
netstat command will show the network statistic. You can find out total established connections, closing connection, SYN and FIN bits and much more. You can also display summary statistics for each protocol using netstat.
You can find out if your server is under attack with netstat. See my previous post here.
3. vmstat
vmstat is a command for monitorig system activity, hardware and system information.
To show processes, memory, paging, block IO, traps, and cpu activity reports:
vmstat
sample output:
procs ------memory---------- --swap-- ---io-- --system-- ----cpu----
r  b   swpd   free   buff  cache   si   so    bi    bo   in    cs    us sy id wa
3  0      0 2485120 621952 2415368  0    0     0     0    0       1 32  0 68  0
4. w
w is a command to show the real time log activity for logged in user.
command:
w [username]
sample:
w ivan
5. ps
ps is a command to display the running processes.
To show all processes:
ps -A
ps ax
ps axu
Show long format output:
ps -Al
Show threads:
ps -AlFH
See processes run by user:
ps -U [username] -u [username] u
Show the top 10 memory consuming process:
ps -auxf | sort -nr -k 4 | head -10
Show the top 10 cpu consuming process:
ps -auxf | sort -nr -k 3 | head -10
6. free
free is a command to show your the memory report. It will show the total amount of free and used physical and swap memory in the system, as well as the buffers used by the kernel.
Usage:
free
7. iostat
iostat is a command to show cpu statistics and input/output statistics for devices, partitions and network filesystems (NFS).
Usage:
iostat
8. mpstat
mpstat is a command to show you multiprocessor usage.
To average CPU utilization per processor:
mpstat -P ALL
9. pmap
pmap is acommand to show memory map of a process.
Usage:
pmap -d PID
Sample to show memory information for process id 14243:
pmap -d 14243
10. iptraf
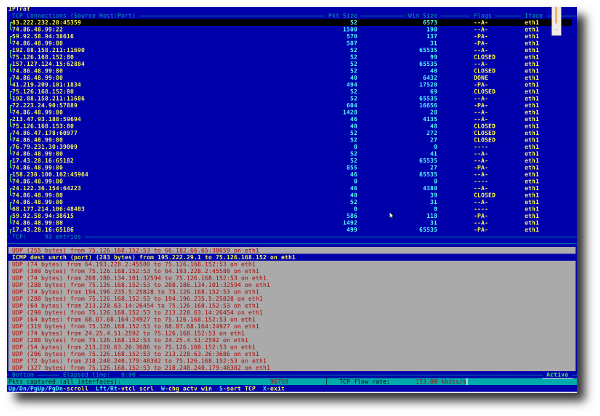
iptraf is a command to show real-time network statistics with interactive colorful ui text based. What can iptraf provide:
* Network traffic statistics by TCP connection
* IP traffic statistics by network interface
* Network traffic statistics by protocol
* Network traffic statistics by TCP/UDP port and by packet size
* Network traffic statistics by Layer2 address
Sample:

